Photo: satoshi sawada / CC BY 2.0 · Wikimedia Commons
Hokkaido
Hokkaido & Tohoku region · Prefecture
Official website
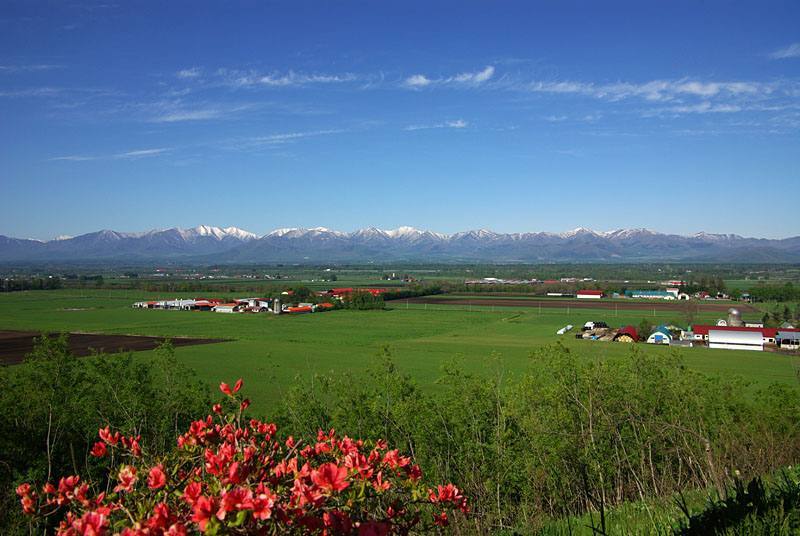
Hokkaido is the largest local government area in Japan and covers about 22% of the country's land. With vast areas of field crops and dairy farming and rich fishing grounds, it is Japan's food base. Untouched nature remains in places such as the Daisetsuzan mountains and Shiretoko.
- Shiretoko (World Natural Heritage Site)
- Dairy farming and field crops
- Seafood
- Skiing
Key facts
- Municipalities
- 179 (35 cities, 129 towns, 15 villages)
Source: Statistics Bureau of Japan, 2025 Population Census (population, area and density); area from the Geospatial Information Authority of Japan (GSI), Area Statistics of Prefectures and Municipalities (2025). National ranks are among the 47 prefectures, ordered by this site from these values.
Places to know
- Sapporo City The main city of the north, with a population of about 1.96 million. Home of the Sapporo Snow Festival.
- Hakodate City A port city known for its night view, its morning market and Goryokaku.
- Asahikawa City Asahiyama Zoo and Asahikawa ramen. A gateway to the Daisetsuzan mountains.
Current warnings, advisories and earthquakes
Places to visit in Hokkaido
 Island · Ruyobetsu VillageKunashiri IslandOne of the islands of the Northern Territories
 Castle · Hakodate CityGoryokakufortress
 Natural monument · Higashikawa TownDaisetsuzan Volcanic Groupmountain range in Hokkaido, Japan
 Island · Rishirifuji TownRishiri Islandisland in Hokkaido, Japan
 Natural monument · Sobetsu TownShowa-shinzanvolcano in Sobetsu, Hokkaido, Japan
 Island · Rebun TownRebun Islandisland in Hokkaido, Japan
 Lake · Sobetsu TownLake Toyacrater lake in Hokkaido, Japan
 Lake · Kushiro City, HokkaidoLake Akanlake in Kushiro, Hokkaidō, Japan
 Lake · Teshikaga TownLake Kussharolake in Teshikaga, Hokkaido, Japan
 Lake · Chitose CityLake Shikotsulake in Japan
Browse by category
Shrines, temples, castles and historic sites
Chosen automatically, most popular first, from landmarks and cultural properties registered in Wikidata (we have not checked whether each is open). Names and descriptions: Wikidata (CC0); photos: Wikimedia Commons (photographer and license under each photo).
National parks in Hokkaido
Chosen by overlaying the park boundaries (Ministry of the Environment, Biodiversity Center of Japan, "National Park Areas" GIS data, updated April 28, 2025, combined and simplified by NIPPON ATLAS) with municipal boundaries (National Land Numerical Information, January 2021), keeping overlaps of about 0.5 km² or more (approximate). Areas are the land areas from the Ministry of the Environment, "Overview of National Parks" (April 10, 2026). All national parks
Municipalities in Hokkaido (185)
| Municipality | Population | 5-year change | Area | Temperature nownearest AMeDAS |
|---|
| Sapporo City | 1,961,996 | −0.6% | 1,121 km² | |
| Hakodate City | 230,309 | −8.3% | 678 km² | |
| Otaru City | 100,269 | −9.9% | 244 km² | |
| Asahikawa City | 305,430 | −7.3% | 748 km² | |
| Muroran City | 73,913 | −10.3% | 81.01 km² | |
| Kushiro City | 151,171 | −8.4% | 1,363 km² | |
| Obihiro City | 160,563 | −3.6% | 619 km² | |
| Kitami City | 108,194 | −6.3% | 1,427 km² | |
| Yubari City | 5,610 | −23.5% | 763 km² | |
| Iwamizawa City | 72,949 | −8.0% | 481 km² | |
| Abashiri City | 32,737 | −8.5% | 471 km² | |
| Rumoi City | 17,329 | −13.8% | 298 km² | |
| Tomakomai City | 164,286 | −3.4% | 562 km² | |
| Wakkanai City | 30,064 | −10.4% | 761 km² | |
| Bibai City | 17,641 | −13.6% | 278 km² | |
| Ashibetsu City | 10,581 | −15.7% | 865 km² | |
| Ebetsu City | 119,455 | −1.3% | 187 km² | |
| Akabira City | 8,261 | −14.8% | 130 km² | |
| Monbetsu City | 19,424 | −8.4% | 831 km² | |
| Shibetsu City | 15,761 | −11.7% | 1,119 km² | |
| Nayoro City | 24,356 | −10.7% | 535 km² | |
| Mikasa City | 6,901 | −14.2% | 303 km² | |
| Nemuro City | 21,241 | −13.8% | 503 km² | |
| Chitose City | 98,077 | +0.1% | 595 km² | |
| Takikawa City | 35,782 | −9.4% | 116 km² | |
| Sunagawa City | 14,976 | −9.2% | 78.68 km² | |
| Utashinai City | 2,448 | −18.1% | 55.95 km² | |
| Fukagawa City | 17,671 | −11.8% | 529 km² | |
| Furano City | 19,274 | −8.8% | 601 km² | |
| Noboribetsu City | 41,947 | −9.6% | 212 km² | |
| Eniwa City | 70,874 | +0.8% | 295 km² | |
| Date City | 30,064 | −8.4% | 444 km² | |
| Kitahiroshima City | 55,772 | −4.1% | 119 km² | |
| Ishikari City | 55,706 | −2.0% | 722 km² | |
| Hokuto City | 40,576 | −8.4% | 397 km² | |
| Tobetsu Town | 14,933 | −6.2% | 423 km² | |
| Shinshinotsu Village | 2,731 | −10.3% | 78.04 km² | |
| Matsumae Town | 5,260 | −16.0% | 293 km² | |
| Fukushima Town | 3,182 | −16.1% | 187 km² | |
| Shiriuchi Town | 3,648 | −12.5% | 197 km² | |
| Kikonai Town | 3,255 | −15.1% | 222 km² | |
| Nanae Town | 26,933 | −2.7% | 217 km² | |
| Shikabe Town | 3,348 | −11.0% | 111 km² | |
| Mori Town | 12,833 | −10.5% | 369 km² | |
| Yakumo Town | 14,781 | −6.6% | 956 km² | |
| Oshamambe Town | 5,305 | +3.8% | 311 km² | |
| Esashi Town | 6,230 | −16.1% | 109 km² | |
| Kaminokuni Town | 3,656 | −15.1% | 548 km² | |
| Assabu Town | 3,098 | −13.8% | 461 km² | |
| Otobe Town | 2,937 | −13.7% | 163 km² | |
| Okushiri Town | 2,050 | −14.9% | 143 km² | |
| Imakane Town | 4,387 | −13.5% | 568 km² | |
| Setana Town | 6,380 | −13.8% | 639 km² | |
| Shimamaki Village | 1,169 | −13.8% | 437 km² | |
| Suttsu Town | 2,495 | −12.1% | 95.25 km² | |
| Kuromatsunai Town | 2,634 | −5.6% | 346 km² | |
| Rankoshi Town | 4,293 | −6.0% | 450 km² | |
| Niseko Town | 5,324 | +4.9% | 197 km² | |
| Makkari Village | 1,967 | −3.8% | 114 km² | |
| Rusutsu Village | 1,876 | −1.8% | 120 km² | |
| Kimobetsu Town | 2,006 | −7.0% | 189 km² | |
| Kyogoku Town | 2,803 | −4.7% | 231 km² | |
| Kutchan Town | 14,728 | −2.7% | 261 km² | |
| Kyowa Town | 5,980 | +3.6% | 305 km² | |
| Iwanai Town | 10,393 | −10.8% | 70.60 km² | |
| Tomari Village | 1,479 | −5.7% | 82.27 km² | |
| Kamoenai Village | 802 | −7.8% | 148 km² | |
| Shakotan Town | 1,496 | −18.3% | 238 km² | |
| Furubira Town | 2,399 | −12.6% | 188 km² | |
| Niki Town | 3,184 | +0.1% | 168 km² | |
| Yoichi Town | 16,464 | −8.5% | 141 km² | |
| Akaigawa Village | 1,069 | −8.2% | 280 km² | |
| Nanporo Town | 7,883 | +7.7% | 81.36 km² | |
| Naie Town | 4,541 | −11.3% | 88.19 km² | |
| Kamisunagawa Town | 2,319 | −18.4% | 39.98 km² | |
| Yuni Town | 4,341 | −10.0% | 134 km² | |
| Naganuma Town | 9,468 | −8.0% | 169 km² | |
| Kuriyama Town | 10,391 | −7.8% | 204 km² | |
| Tsukigata Town | 2,999 | −18.7% | 150 km² | |
| Urausu Town | 1,527 | −11.8% | 102 km² | |
| Shintotsukawa Town | 6,100 | −5.9% | 495 km² | |
| Moseushi Town | 2,332 | −13.4% | 48.64 km² | |
| Chippubetsu Town | 2,110 | −9.4% | 47.18 km² | |
| Uryu Town | 2,140 | −10.4% | 191 km² | |
| Hokuryu Town | 1,529 | −11.3% | 159 km² | |
| Numata Town | 2,653 | −8.8% | 283 km² | |
| Takasu Town | 6,188 | −5.8% | 139 km² | |
| Higashikagura Town | 9,586 | −5.3% | 68.50 km² | |
| Toma Town | 5,824 | −7.8% | 205 km² | |
| Pippu Town | 3,256 | −7.5% | 86.90 km² | |
| Aibetsu Town | 2,288 | −12.2% | 250 km² | |
| Kamikawa Town | 3,165 | −9.6% | 1,049 km² | |
| Higashikawa Town | 8,699 | +4.6% | 247 km² | |
| Biei Town | 9,327 | −3.5% | 677 km² | |
| Kamifurano Town | 9,152 | −11.6% | 237 km² | |
| Nakafurano Town | 4,280 | −9.6% | 109 km² | |
| Minamifurano Town | 2,190 | −7.8% | 666 km² | |
| Shimukappu Village | 1,486 | +13.8% | 571 km² | |
| Wassamu Town | 2,667 | −16.4% | 225 km² | |
| Kenbuchi Town | 2,642 | −9.7% | 131 km² | |
| Shimokawa Town | 2,742 | −12.3% | 645 km² | |
| Bifuka Town | 3,636 | −12.3% | 672 km² | |
| Otoineppu Village | 603 | −14.6% | 276 km² | |
| Nakagawa Town | 1,230 | −19.5% | 595 km² | |
| Horokanai Town | 1,199 | −12.5% | 767 km² | |
| Mashike Town | 3,343 | −14.5% | 370 km² | |
| Obira Town | 2,556 | −14.6% | 627 km² | |
| Tomamae Town | 2,554 | −13.0% | 455 km² | |
| Haboro Town | 5,641 | −13.9% | 473 km² | |
| Shosanbetsu Village | 942 | −12.8% | 280 km² | |
| Embetsu Town | 2,168 | −14.0% | 591 km² | |
| Teshio Town | 2,534 | −14.1% | 354 km² | |
| Sarufutsu Village | 2,502 | −4.2% | 590 km² | |
| Hamatonbetsu Town | 3,046 | −11.7% | 402 km² | |
| Nakatonbetsu Town | 1,415 | −13.6% | 399 km² | |
| Esashi Town | 7,021 | −7.2% | 1,116 km² | |
| Toyotomi Town | 3,432 | −13.6% | 521 km² | |
| Rebun Town | 2,179 | −13.2% | 81.64 km² | |
| Rishiri Town | 1,766 | −11.9% | 76.50 km² | |
| Rishirifuji Town | 2,140 | −12.9% | 106 km² | |
| Horonobe Town | 2,012 | −15.1% | 574 km² | |
| Bihoro Town | 16,691 | −10.7% | 438 km² | |
| Tsubetsu Town | 3,776 | −13.7% | 717 km² | |
| Shari Town | 10,671 | −6.5% | 737 km² | |
| Kiyosato Town | 3,569 | −8.1% | 403 km² | |
| Koshimizu Town | 4,196 | −9.2% | 287 km² | |
| Kunneppu Town | 4,239 | −9.4% | 191 km² | |
| Oketo Town | 2,468 | −11.1% | 527 km² | |
| Saroma Town | 4,332 | −11.1% | 405 km² | |
| Engaru Town | 17,031 | −11.5% | 1,332 km² | |
| Yubetsu Town | 7,524 | −9.0% | 506 km² | |
| Takinoue Town | 2,093 | −13.5% | 767 km² | |
| Okoppe Town | 3,360 | −7.4% | 363 km² | |
| Nishiokoppe Village | 913 | −13.3% | 308 km² | |
| Omu Town | 3,858 | −8.1% | 637 km² | |
| Ozora Town | 6,204 | −8.4% | 344 km² | |
| Toyoura Town | 3,404 | −10.9% | 234 km² | |
| Sobetsu Town | 2,354 | −14.2% | 205 km² | |
| Shiraoi Town | 14,564 | −10.2% | 426 km² | |
| Atsuma Town | 4,154 | −6.3% | 405 km² | |
| Toyako Town | 7,799 | −7.6% | 181 km² | |
| Abira Town | 6,948 | −5.3% | 237 km² | |
| Mukawa Town | 7,146 | −6.6% | 711 km² | |
| Hidaka Town | 10,290 | −8.8% | 992 km² | |
| Biratori Town | 4,331 | −9.3% | 743 km² | |
| Niikappu Town | 4,756 | −10.4% | 586 km² | |
| Urakawa Town | 11,110 | −8.0% | 694 km² | |
| Samani Town | 3,665 | −9.3% | 364 km² | |
| Erimo Town | 3,732 | −14.7% | 284 km² | |
| Shinhidaka Town | 19,552 | −9.1% | 1,148 km² | |
| Otofuke Town | 41,942 | −3.7% | 466 km² | |
| Shihoro Town | 5,379 | −8.0% | 259 km² | |
| Kamishihoro Town | 4,470 | −6.4% | 694 km² | |
| Shikaoi Town | 4,860 | −7.7% | 403 km² | |
| Shintoku Town | 5,223 | −10.2% | 1,064 km² | |
| Shimizu Town | 8,360 | −8.1% | 402 km² | |
| Memuro Town | 17,212 | −4.6% | 514 km² | |
| Nakasatsunai Village | 3,801 | −2.1% | 293 km² | |
| Sarabetsu Village | 2,996 | −2.7% | 177 km² | |
| Taiki Town | 5,124 | −5.5% | 816 km² | |
| Hiroo Town | 5,504 | −13.8% | 596 km² | |
| Makubetsu Town | 24,199 | −6.1% | 478 km² | |
| Ikeda Town | 5,587 | −11.2% | 372 km² | |
| Toyokoro Town | 2,700 | −10.7% | 537 km² | |
| Hombetsu Town | 5,688 | −14.1% | 392 km² | |
| Ashoro Town | 5,600 | −14.7% | 1,408 km² | |
| Rikubetsu Town | 1,992 | −12.0% | 609 km² | |
| Urahoro Town | 3,851 | −12.2% | 730 km² | |
| Kushiro Town | 17,830 | −6.7% | 252 km² | |
| Akkeshi Town | 7,861 | −11.6% | 739 km² | |
| Hamanaka Town | 5,112 | −7.2% | 423 km² | |
| Shibecha Town | 6,516 | −9.9% | 1,099 km² | |
| Teshikaga Town | 6,180 | −11.1% | 774 km² | |
| Tsurui Village | 2,394 | −6.4% | 572 km² | |
| Shiranuka Town | 6,603 | −9.4% | 773 km² | |
| Betsukai Town | 13,281 | −7.6% | 1,317 km² | |
| Nakashibetsu Town | 21,783 | −5.3% | 685 km² | |
| Shibetsu Town | 4,610 | −8.2% | 625 km² | |
| Rausu Town | 4,024 | −14.8% | 398 km² | |
| Shikotan Village | — | — | — | — |
| Tomari Village | — | — | — | — |
| Ruyobetsu Village | — | — | — | — |
| Rubetsu Village | — | — | — | — |
| Shana Village | — | — | — | — |
| Shibetoro Village | — | — | — | — |
Source: Statistics Bureau of Japan, 2025 Population Census (population in 2025; change compared with 2020). Area: GSI (2025). Designated cities are shown as one city (wards combined). "Temperature now" is the latest JMA AMeDAS observation (preliminary) at the nearest station in the same prefecture, loaded and shown unchanged when you open the page.